When you have more candidate items than capacity to ship them. Most useful for feature ranking within an MVP scope, growth experiment selection, and channel prioritization. ICE is the quantitative ranking pass that comes after [MoSCoW](/frameworks/moscow) has done the qualitative bucket sort.
How to apply ICE Scoring
- 1
List every candidate item
Features for V1, growth experiments to run, channels to test, content pieces to write. ICE works on any prioritizable list. Get every candidate on the table without filtering. The framework's value depends on starting from a complete set.
- 2
Score Impact 1-10
How much will this item move the metric that matters? For a feature: how much does it move conversion, retention, or revenue? For a growth experiment: how much does it move the funnel step you're testing? Be specific about which metric and which direction. Vague 'big impact' scores produce vague rankings.
- 3
Score Confidence 1-10
How sure are you about the Impact score? Confidence is where most ICE scoring breaks down because founders inflate it for pet projects. Force yourself to name three pieces of evidence that support the Impact estimate. If you can't, Confidence drops below 5. Confidence above 8 should require strong evidence (prior experiments, user research data, benchmark data).
- 4
Score Ease 1-10
How easy is this to build or execute? 10 = trivial (an hour of work). 1 = massive (months). For features, Ease incorporates engineering time, design time, testing time, and any external dependencies. Founders without engineering instincts often score Ease too high. Verify with whoever will build it.
- 5
Multiply and rank
ICE Score = Impact × Confidence × Ease. Rank items by total score. The top 30-40% goes into the active sprint or build. Below that, items wait. Re-score every 4-8 weeks as evidence accumulates. ICE is dynamic, not a one-time exercise.
Why “we have ten high-priority features” means nothing
Most founder feature lists rank by gut. The features the founder gets excited about float to the top. The features the team agrees are important sit in the middle. The features nobody loves slide off the bottom.
That’s not prioritization. That’s preference dressed as strategy.
ICE Scoring (Sean Ellis, popularized via GrowthHackers around 2014) is the simplest framework that forces explicit, numeric scoring of three dimensions. The math doesn’t matter as much as the discipline of having to score honestly. Specifically: having to defend your Confidence score with evidence.
The three multipliers
Impact (1-10): how much does this item move the metric that matters?
Impact requires a defined target metric. “Impact on what, exactly?” If the metric isn’t named, the score is meaningless. Common metrics:
- Conversion rate (impressions → signups)
- Activation rate (signups → first meaningful action)
- Retention (cohort retention at week 4, 12, 24)
- Revenue per cohort
- CAC reduction
Pick the metric that matters most for your current stage. For pre-PMF, that’s usually conversion or activation. For early growth, it’s retention. For scaling, it’s CAC and revenue per cohort.
Confidence (1-10): how sure are you about the Impact score?
Confidence is where ICE earns or loses its value. Without honest Confidence scoring, the framework becomes a justification engine: high Confidence for pet projects, low Confidence for things you don’t like.
The discipline: force yourself (or a co-founder, or an advisor) to name three pieces of evidence supporting any Confidence score above 7. Evidence types:
- Prior experiment results from your own product
- User research data (interviews, surveys, behavior analytics)
- Industry benchmark data (cohort data from similar products)
- Validated patterns from comparable startups
If you can’t name three pieces of evidence, Confidence drops to 5 or below. This is the framework’s main analytical bite.
Ease (1-10): how easy is this to build or execute?
10 = trivial (an hour of work). 1 = massive (months). For features, Ease incorporates:
- Engineering time
- Design time
- Testing time
- External dependencies (APIs, integrations, contracts)
- Risk-adjusted time (multiply by 1.5 if there’s unknown complexity)
Founders without engineering instincts systematically overscore Ease. Verify with whoever will actually build it.
The math
ICE Score = Impact × Confidence × Ease
Multiply, not add. Multiplication means a weakness in any dimension drags the total down. A 10-10-1 (100) ranks below a 6-6-6 (216) because the high-effort item needs exceptional impact AND confidence to clear a moderate-everything alternative.
A worked example
You’re prioritizing 6 features for V1.1 of a customer feedback tool. Target metric: 30-day retention.
| Feature | Impact | Confidence | Ease | ICE Score |
|---|---|---|---|---|
| Public-facing roadmap voting | 7 | 8 | 6 | 336 |
| Slack integration | 5 | 9 | 8 | 360 |
| Browser extension for inline feedback | 8 | 5 | 4 | 160 |
| Email digest of new feedback | 6 | 8 | 7 | 336 |
| AI feedback theme clustering | 9 | 4 | 3 | 108 |
| Native iOS app | 7 | 6 | 2 | 84 |
Ranking by ICE: Slack (360), roadmap voting (336, tied), email digest (336, tied), browser extension (160), AI clustering (108), iOS app (84).
Now check Confidence. Why is Slack 9? Because you have data from 4 prior B2B SaaS products you’ve built showing Slack integration is a top-3 retention driver. That’s 3+ pieces of evidence; 9 holds.
Why is browser extension 5? Because the Impact (8) is from your own intuition that “inline feedback would be huge.” No evidence yet. 5 is the right Confidence; if you score it 9, you’re inflating.
Why is AI clustering 4? Because you’re not sure whether this actually moves retention. It might just be a feature users notice but don’t change behavior on. 4 is honest.
The rankings suggest: build Slack first, then roadmap voting and email digest (tied), then browser extension. Skip AI clustering and iOS app for V1.1. They go in the V2 file.
Confidence is the audit
The biggest mistake in ICE: scoring Confidence by feeling rather than evidence.
The audit:
For each item with Confidence ≥ 7, write down the evidence in one sentence. Examples:
- “Prior experiment in our last product showed inline feedback increased 30-day retention by 22%.”
- “User interview with 12 buyers had 9 explicitly mention email digest as a feature they’d pay for.”
- “Benchmark data from Public.com’s 2024 case study shows Slack integration moves retention 15-20% in similar tools.”
If you can’t write that sentence, the Confidence is inflated. Drop it.
The audit catches most pet-project bias. It also catches over-cautious scoring on items where you actually have evidence but defaulted to a middle score.
When NOT to use ICE
ICE is a quantitative ranking tool. It assumes:
- You have a list of candidate items (not generating ideas, just ranking them)
- The items are comparable on the same metric (not “should we build feature X or rebrand?”)
- You can estimate effort honestly (not “we’ll figure it out later”)
When these don’t hold, ICE produces garbage rankings. For idea generation, use lateral techniques (mind mapping, customer interview synthesis) first. For comparing items with different metric impacts, decide the meta-priority first (“revenue this quarter vs retention this year”) before running ICE within each meta-priority.
ICE vs MoSCoW
MoSCoW and ICE complement each other:
- MoSCoW is qualitative and discrete (4 buckets). Used first to sort what’s even in scope for the version.
- ICE is quantitative and continuous (numerical scores). Used second to rank within the Must list.
Workflow: apply MoSCoW to get the Must items for V1. Then apply ICE to the Must list to sequence development order. Build highest-ICE first.
Common mistakes
1. Confidence inflation. Pet projects get 9. Demand evidence for any 8+.
2. No defined metric. Score against a specific metric or scores are meaningless.
3. Ease overscored. Founders without dev backgrounds systematically overestimate Ease. Verify with builders.
4. Static scores. Re-score every 4-8 weeks as evidence accumulates.
5. Treating ICE as the final decision. ICE ranks. You still decide based on the ranking PLUS qualitative coherence (do the top items make a sensible product or campaign?).
ShipFit and ICE
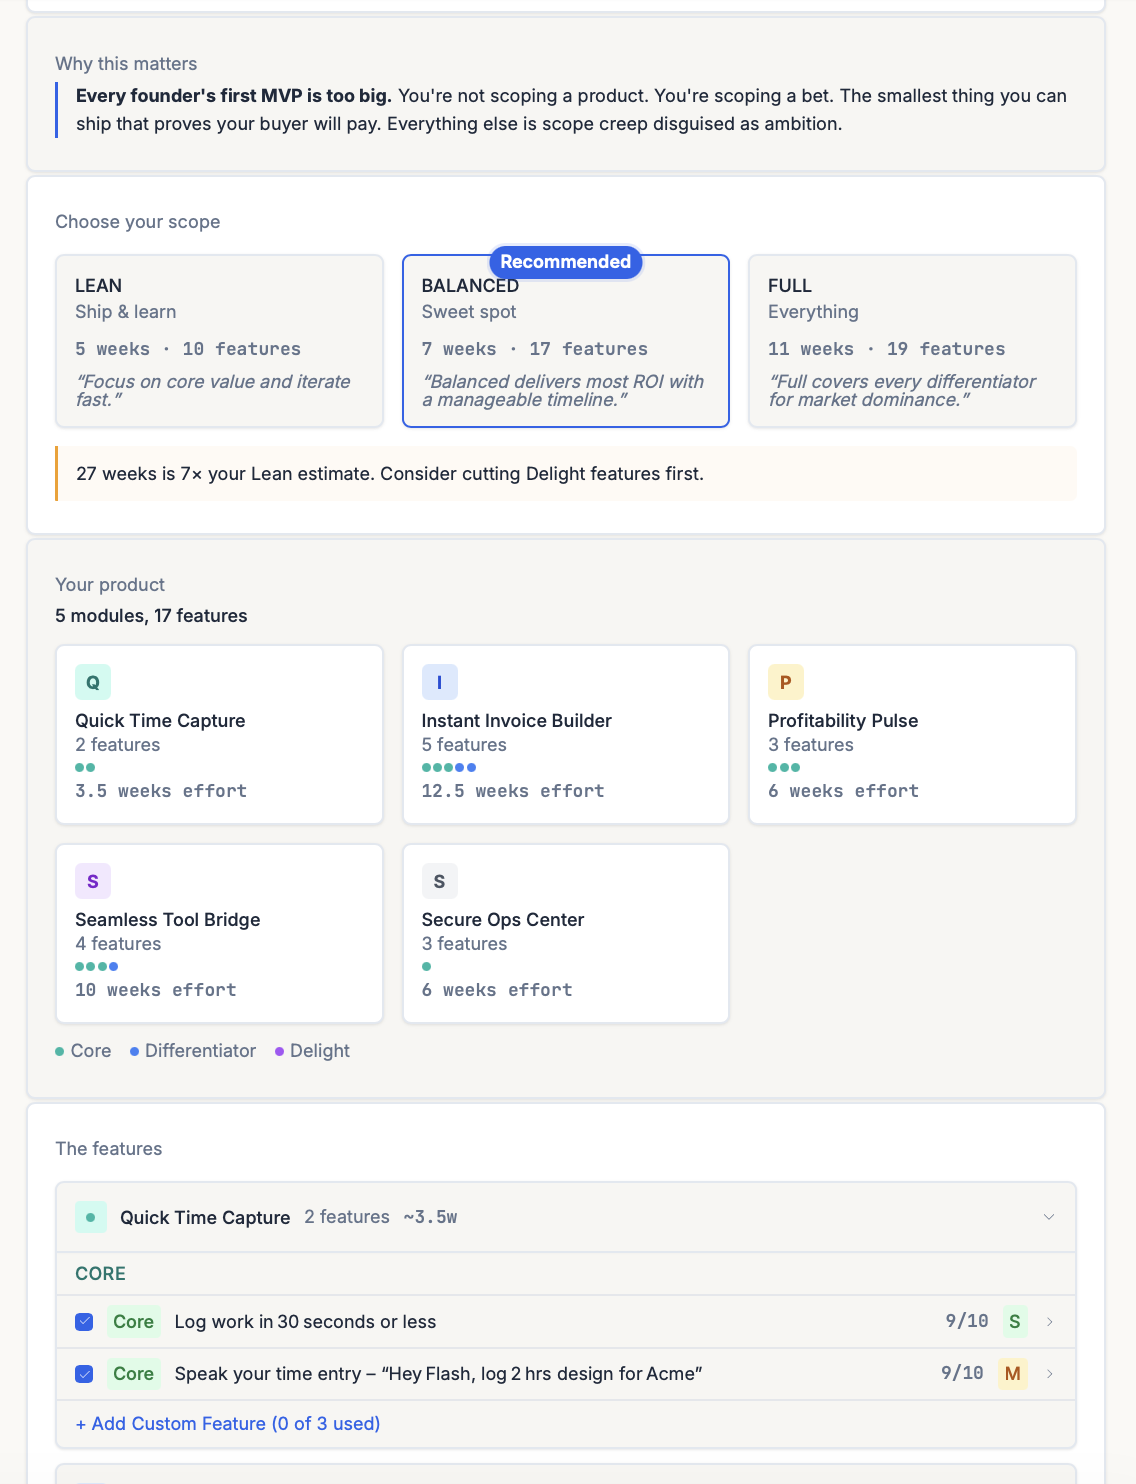
The most visible ICE-style scoring in the ShipFit product is Stage 5 (What’s V1?). Every candidate feature gets a 0-10 score (rolling Impact + Confidence into one number) plus an S / M / L effort tag (the Ease dimension, kept categorical so it can’t be over-engineered). Features are then sorted into three buckets that determine cut order:
- Differentiator: the 3-5 features that make the buyer pick you over the incumbent. Keep all, regardless of effort.
- Delight: features users will love but can’t afford yet. Cut first, the explicit instruction in the UI. Most go to V2.
- Operational: the plumbing that makes the Differentiators work (auth, billing, basic admin). Keep the minimum.
The cut decisions are visible (each feature shows its score + tag side by side) instead of hidden in a spreadsheet. ShipFit’s Confidence audit forces evidence for any score ≥ 7. If you can’t name evidence, the system drops the score to 5 and recomputes the ranking. The audit removes the pet-project bias that breaks most founder-run ICE exercises.
ICE shows up again at:
Stage 6 (How to Charge?). Each competitor gets a 0-100 Feature Score plotted against price; the resulting Pricing Position drops you into a Value / Premium / Budget / Overpriced zone with a Recommended price.
Stage 8 (How to Launch?). ICE ranks candidate launch channels (Twitter, Product Hunt, outreach, etc.) so you pick the top 2 by total score. See launch-plan spoke for the full channel-ICE workflow.
Further reading
- Sean Ellis’s GrowthHackers post (2014) introducing ICE for growth experiments. Search “ICE Score GrowthHackers.”
- Itamar Gilad’s “Confidence Meter” (2018). A deeper take on the Confidence dimension specifically, including the role of evidence types in scoring.
- MoSCoW prioritization. Pairs with ICE for full prioritization workflow.
- Lean Startup validation. Provides the experiment-design framework that gives ICE its Confidence inputs.
Common mistakes
- Inflating Confidence for pet projects. The most common failure. If you can't name three pieces of evidence supporting the Impact estimate, Confidence should be 5 or below. Honest Confidence scores are the framework's value.
- Treating Ease as a tiebreaker rather than a multiplier. Ease has the same weight as Impact and Confidence in the multiplication. A 9-9-1 score (199) ranks below a 6-6-6 score (216). High-effort items need exceptional impact AND confidence to make the cut.
- Scoring without a defined metric. 'Impact on what?' If the metric isn't named, scores are arbitrary. Define the target metric before scoring. Different metrics produce different rankings.
- Doing ICE once and never updating. As experiments run, Confidence scores should update. As capacity changes, the cutoff line shifts. ICE is a live ranking, not a static one.
- Conflating ICE with deciding what to do. ICE is a sorting tool. It tells you what's ranked higher than what. It doesn't tell you what to actually do. That requires the qualitative judgment about whether the highest-ranked items make a coherent product or campaign.
How ShipFit operationalizes this
ShipFit applies ICE-style scoring inside Stage 5 (What's V1?), where the feature matrix ranks every candidate by Impact, Confidence, and Ease (with an S/M/L effort tag). Stage 8 (How to Launch?) uses the same logic to rank channels. The discipline ICE forces — naming the evidence behind each Confidence number instead of guessing — is the part founders skip; the scored feature list makes that gap visible.
ShipFit runs 55 frameworks across 9 decision stages
ICE Scoring is one tool in a bigger toolkit. The full library covers market sizing, buyer discovery, MVP scoping, pricing, and launch.
The Mom Test
Q3Rob Fitzpatrick
Validation question methodology — real interviews, not theater
Jobs-to-be-Done
Q2-Q4Clayton Christensen
Functional, social, and emotional jobs your product fulfills
7 Powers
Q4Hamilton Helmer
Strategic moats: Scale, Network, Counter-positioning, Switching, Brand, Cornered Resource, Process
Van Westendorp PSM
Q6Feature-weighted price sensitivity analysis without guessing
Blue Ocean Strategy
Q4Kim & Mauborgne
ERRC framework: Eliminate, Reduce, Raise, Create
Fake Door Testing
Q7Pre-build behavioral validation with landing pages and apology modals
+ 49 more: TAM/SAM/SOM Analysis, Porter's Five Forces, Market Timing Analysis, Unit Economics (LTV/CAC)...
Frequently asked questions
What is ICE Scoring?
How is ICE different from RICE?
Why does Confidence inflation matter?
What's a good Impact score?
How often should I re-score?
Can ICE be used outside software?
What's the cutoff for what to actually build vs deprioritize?
Keep exploring
The 9-step playbook from market verdict to ship-ready spec.
The Mom Test is Rob Fitzpatrick's framework for customer interviews that generate real signal. Not praise. Three rules, applied step-by-step, with examples.
The Van Westendorp framework uses 4 questions to surface a defensible price range. Here's how to run it, interpret the results, and avoid the usual mistakes.
Most founder market research is a TAM slide that nobody believes. The numbers that actually matter are smaller, harder to defend, and tell you whether the market exists for the ten-customer version of your business.
Most founders confuse idea validation with idea-receiving-encouragement. The two have nothing in common. Here's what real validation looks like, and the four methods that actually produce it.
Does each customer make you money? Or cost you money?
Run nine framework-backed decisions in order before writing code: define the buyer, prove the pain is painful, name the winning angle, scope V1 to the smallest test of the hypothesis, get behavioral evidence (paid pre-orders, signed letters of intent, or credit cards on file from a Fake Door Test), then ship. Most failed startups skipped at least three of those nine. Plan to spend two to four weeks on this. It saves six to nine months of building the wrong thing.
For indie hackers who've wasted months on dead ideas. ShipFit forces 9 decisions before you write a line of code. Proven frameworks, exports to Cursor.
If you want a conversation partner, Buildpad. If you want to stop researching and ship, ShipFit. Both solve different problems for different founders. Don't pick on hype.
Ready to make your next product a success?
9 decisions between your idea and a product worth building.